Feature update: Success rate
An increasingly popular stat in the NFL is success rate. From Pro Football Reference:
Success Rate starts with the idea that not all plays in football have the same objective. On first and 10, a two-yard run would be considered a bad result; on third and one, that same two-yard run would be celebrated for moving the chains. This means we can't just use stats like yards to measure how effective an offense is. Instead, Success Rate shows us how effective players and teams are at staying on schedule and creating productive plays.
As a result, a successful play depends on the context. We define it as a play that gains at least 40% of yards required on 1st down, 60% of yards required on 2nd down, and 100% on 3rd or 4th down.
When I began looking into it, it resonated for me with NASCAR. When only one driver can win a race, there must be a different definition of success. I suspect most drivers will tell you that finishing better than where they started is a success. However, when you look at the top ten winningest seasons since 2017, you'll see most of them wouldn't be successful by that definition:
| Driver | Season | Starts | Wins | ASP | AFP |
|---|---|---|---|---|---|
| Kyle Larson | 2021 | 36 | 10 | 6.08 | 9.08 |
| Kevin Harvick | 2020 | 36 | 9 | 7.67 | 7.33 |
| Martin Truex Jr. | 2017 | 36 | 8 | 6.78 | 9.42 |
| Kyle Busch | 2018 | 36 | 8 | 7.42 | 8.31 |
| Kevin Harvick | 2018 | 36 | 8 | 8.75 | 8.83 |
| Martin Truex Jr. | 2019 | 36 | 7 | 13.11 | 9.75 |
| Denny Hamlin | 2020 | 36 | 7 | 8.86 | 9.31 |
| William Byron | 2023 | 36 | 6 | 10.89 | 10.97 |
| Denny Hamlin | 2019 | 36 | 6 | 11.00 | 9.47 |
| Chase Elliott | 2022 | 36 | 5 | 10.67 | 12.47 |
That definition works mid-pack, where starting position is roughly the same as average finish, and when you get far enough forward, you just want to be competing for wins (see here). I suspect what drivers and fans thereof really want is to finish ahead of where you'd expect to finish for your starting position. Hence PFAE and wARP, which both depend on the concept. PFAE specifically measures how many positions better than that expected finish you actually finished.
 Justin Barber
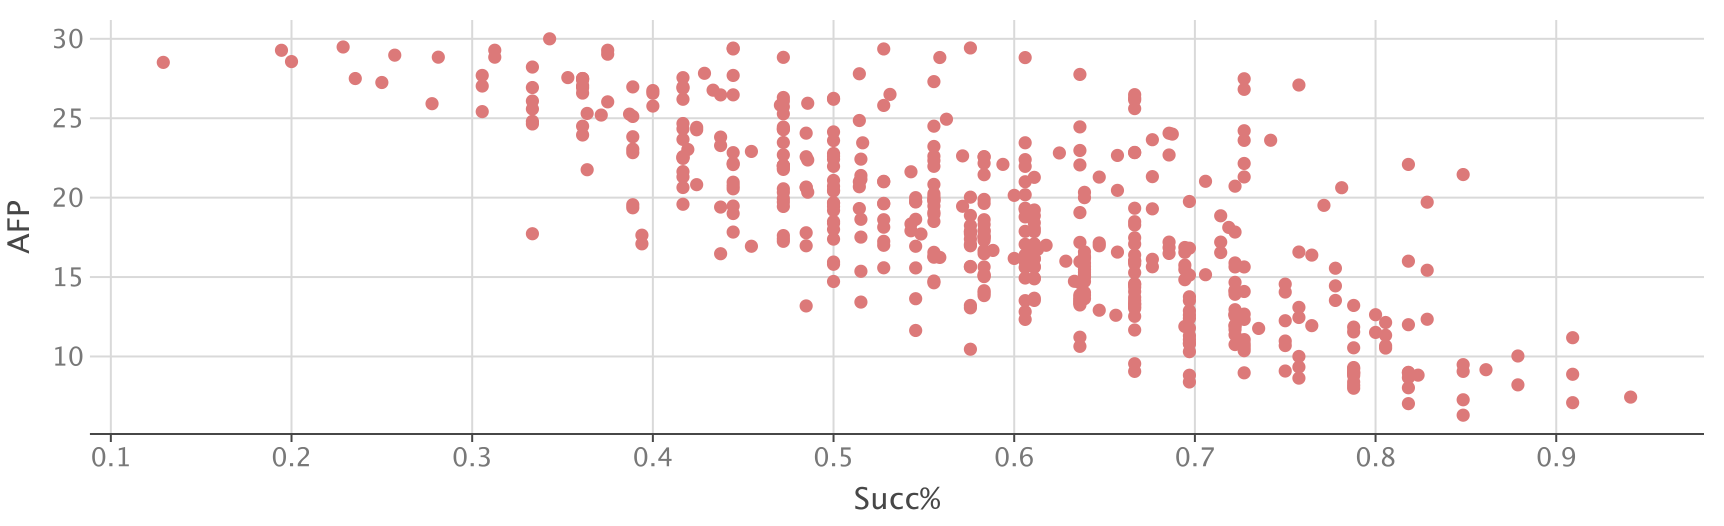
Lap Raptor now has a success rate that is built on the same concept. It simply asks how often a driver is finishing better than would be expected based on starting position. Some quick examples:
- Start 30th in Cup, finish 25th. That is a gain of five positions but not a success, because 30th place drivers average a 24th place finish.
- Start 1st in Cup, finish 6th. That is a loss of five positions, but is a success, because the pole sitter averages a 12th place finish.
You can see from that example why comparing actual finish to expected finish is better than comparing it to starting position. This definition of success rate meets drivers where they are. It also doesn't ask for the impossible by asking the pole sitter to finish better than first place in order to have a success.
Here is a distribution of driver seasons since 2000:
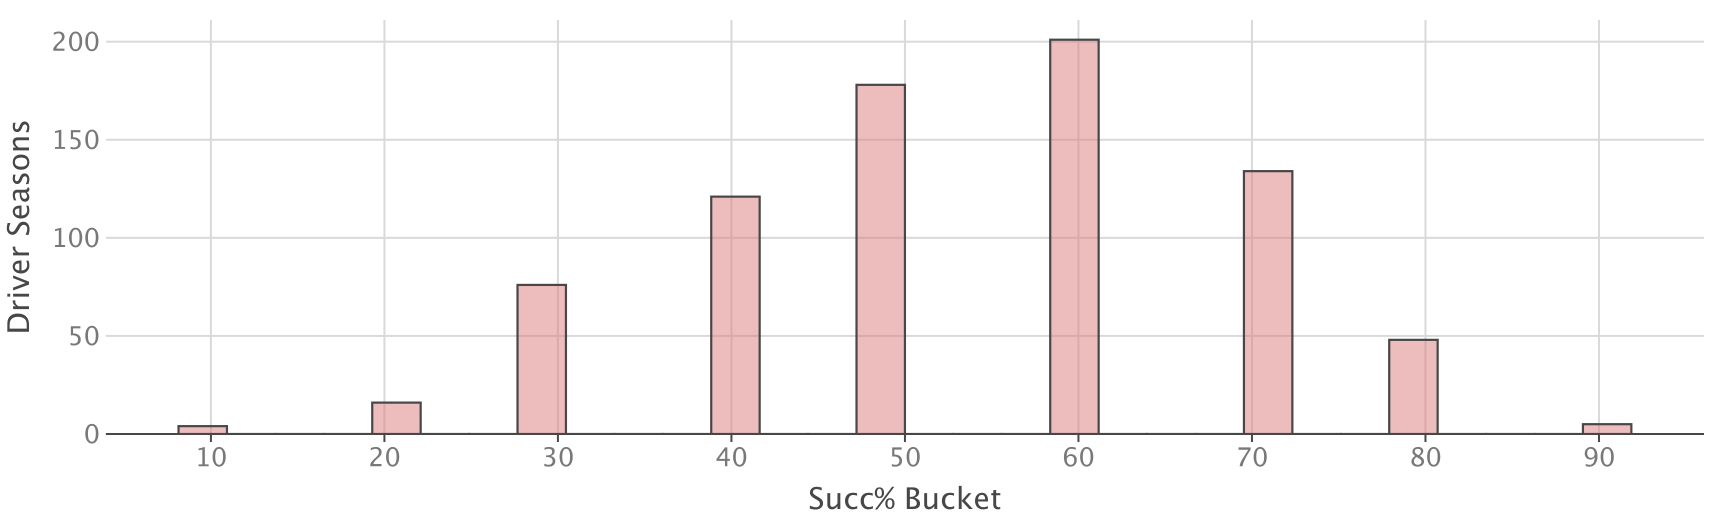
Rule of thumb:
- 80+% is elite
- 70+% is championship contention
- 60+% is good
- 50+% is playoff contention
- Sub-50% is bad
- Sub-30% is unacceptable
Success rate is now available everywhere on Lap Raptor. You'll find it in tables as Succ%. Here are some selected tables:
2024 non-drafting ovals, Cup:
| Driver | Starts | Wins | ASP | ARP | AFP | Succ% |
|---|---|---|---|---|---|---|
| Tyler Reddick | 28 | 3 | 8.68 | 9.89 | 11.92 | 78.9 |
| Kyle Larson | 31 | 4 | 7.67 | 11.67 | 7.75 | 77.8 |
| Chris Buescher | 31 | 2 | 18.95 | 13.84 | 14.70 | 73.7 |
| Chase Elliott | 28 | 1 | 10.89 | 9.84 | 10.38 | 73.7 |
| Noah Gragson | 25 | 0 | 21.32 | 19.16 | 18.76 | 68.4 |
2024 non-drafting ovals, Trucks:
| Driver | Starts | Wins | ASP | ARP | AFP | Succ% |
|---|---|---|---|---|---|---|
| Christian Eckes | 23 | 3 | 6.31 | 3.92 | 4.13 | 100.0 |
| Tanner Gray | 24 | 0 | 16.00 | 14.08 | 14.67 | 76.9 |
| Taylor Gray | 18 | 0 | 10.92 | 13.08 | 11.91 | 76.9 |
| Rajah Caruth | 21 | 1 | 9.54 | 11.85 | 12.46 | 76.9 |
| Nick Sanchez | 22 | 1 | 9.69 | 8.77 | 9.61 | 76.9 |
| Corey Heim | 21 | 5 | 8.92 | 8.46 | 5.40 | 76.9 |
Next Gen non-drafting ovals, Cup:
| Driver | Starts | Wins | ASP | ARP | AFP | Succ% |
|---|---|---|---|---|---|---|
| Kevin Harvick | 58 | 2 | 16.88 | 11.94 | 12.72 | 77.6 |
| Chris Buescher | 76 | 3 | 16.25 | 15.00 | 14.07 | 71.1 |
| Chase Elliott | 72 | 4 | 12.69 | 10.91 | 12.21 | 70.8 |
| Ross Chastain | 77 | 3 | 14.12 | 11.80 | 13.34 | 70.1 |
| William Byron | 77 | 8 | 10.30 | 10.28 | 12.88 | 70.1 |