New Feature Experiment: Expected Finish Charts
Expected finishes are coming to Lap Raptor.
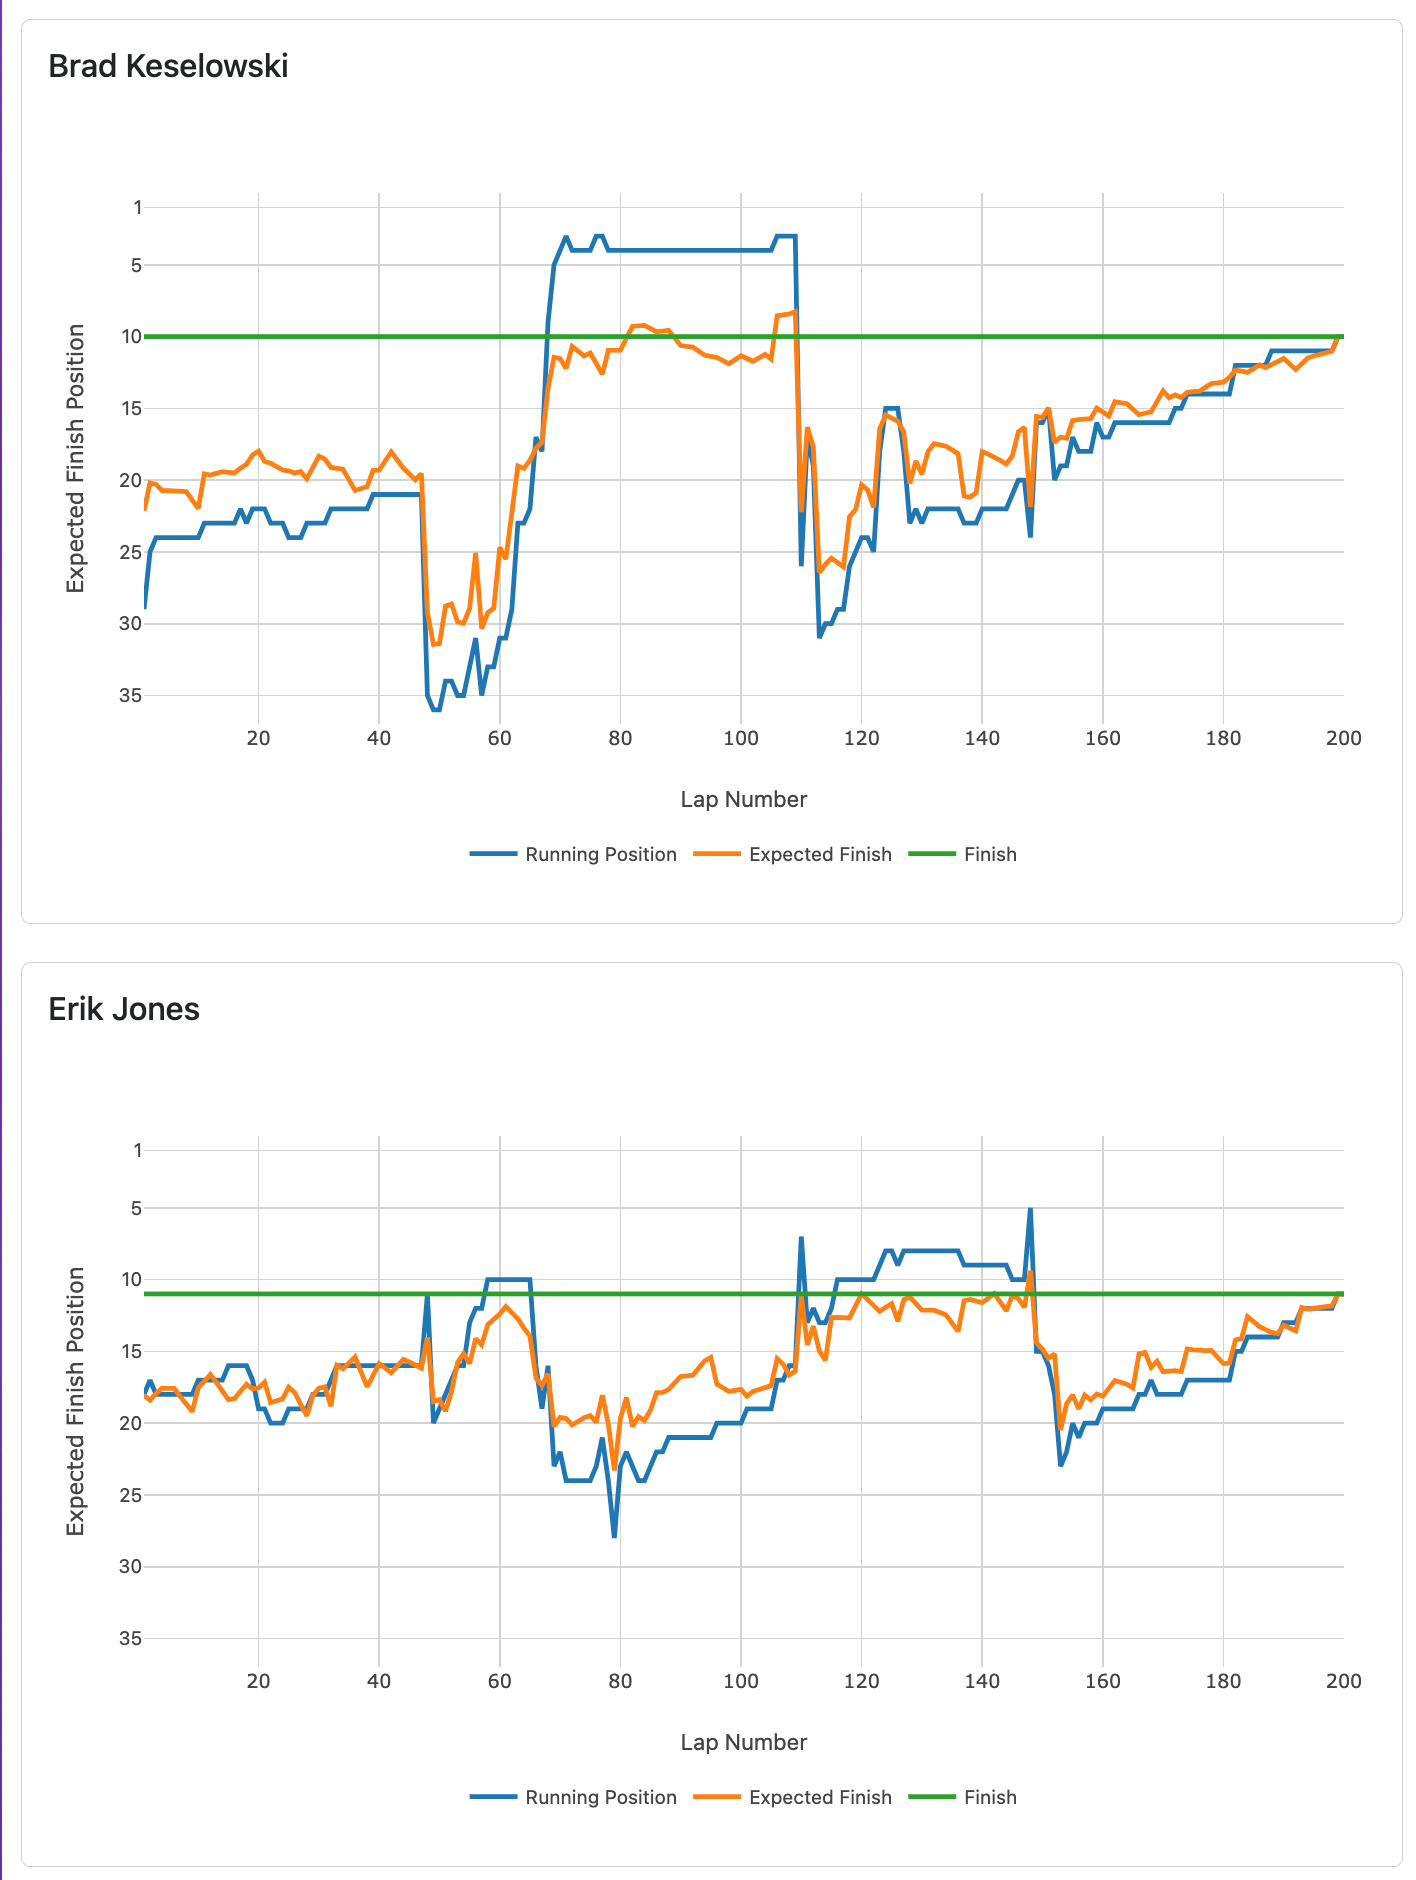
Now on race result pages: expected finish charts. For example:
How does it work? Consider a race to be a 100 percent markers instead of laps. Now, consider that given a history of NASCAR races, we could find the average finish for a driver who is running in position P at race completion percentage C. Do that for every driver-lap in a given race. We are specific enough to do this on a track-type level.
For example, we can see in the chart at the bottom of the page that Brad Keselowski is running roughly 3rd at the lap ~107 mark, which is about 53% through the race. You can see his expected finish is about 8th. So, historically, drivers running 3rd ~53% of the way through a race on intermediates finish 8th on average.
We have lap-by-lap data back to 2020. That's enough to be dangerous with, but not enough to be perfect with.
- We fudge the percentages a bit. If we don't have a large enough sample for the exact completion percentage, we'll borrow up to 5% on either side to get a larger sample.
- We always use the whole data set. That means if you go back and look at a 2021 race, we're calculating the driver's average finish using data from 2025. That doesn't make a tremendous amount of sense, but it's necessary for now — we'll otherwise have insufficient data.
Hence: experimental.